Read your link analytics
What the numbers on a link page mean, how the date range works, and where leads and sales come from.
Open any link from the Links page, or from the post it is attached to.
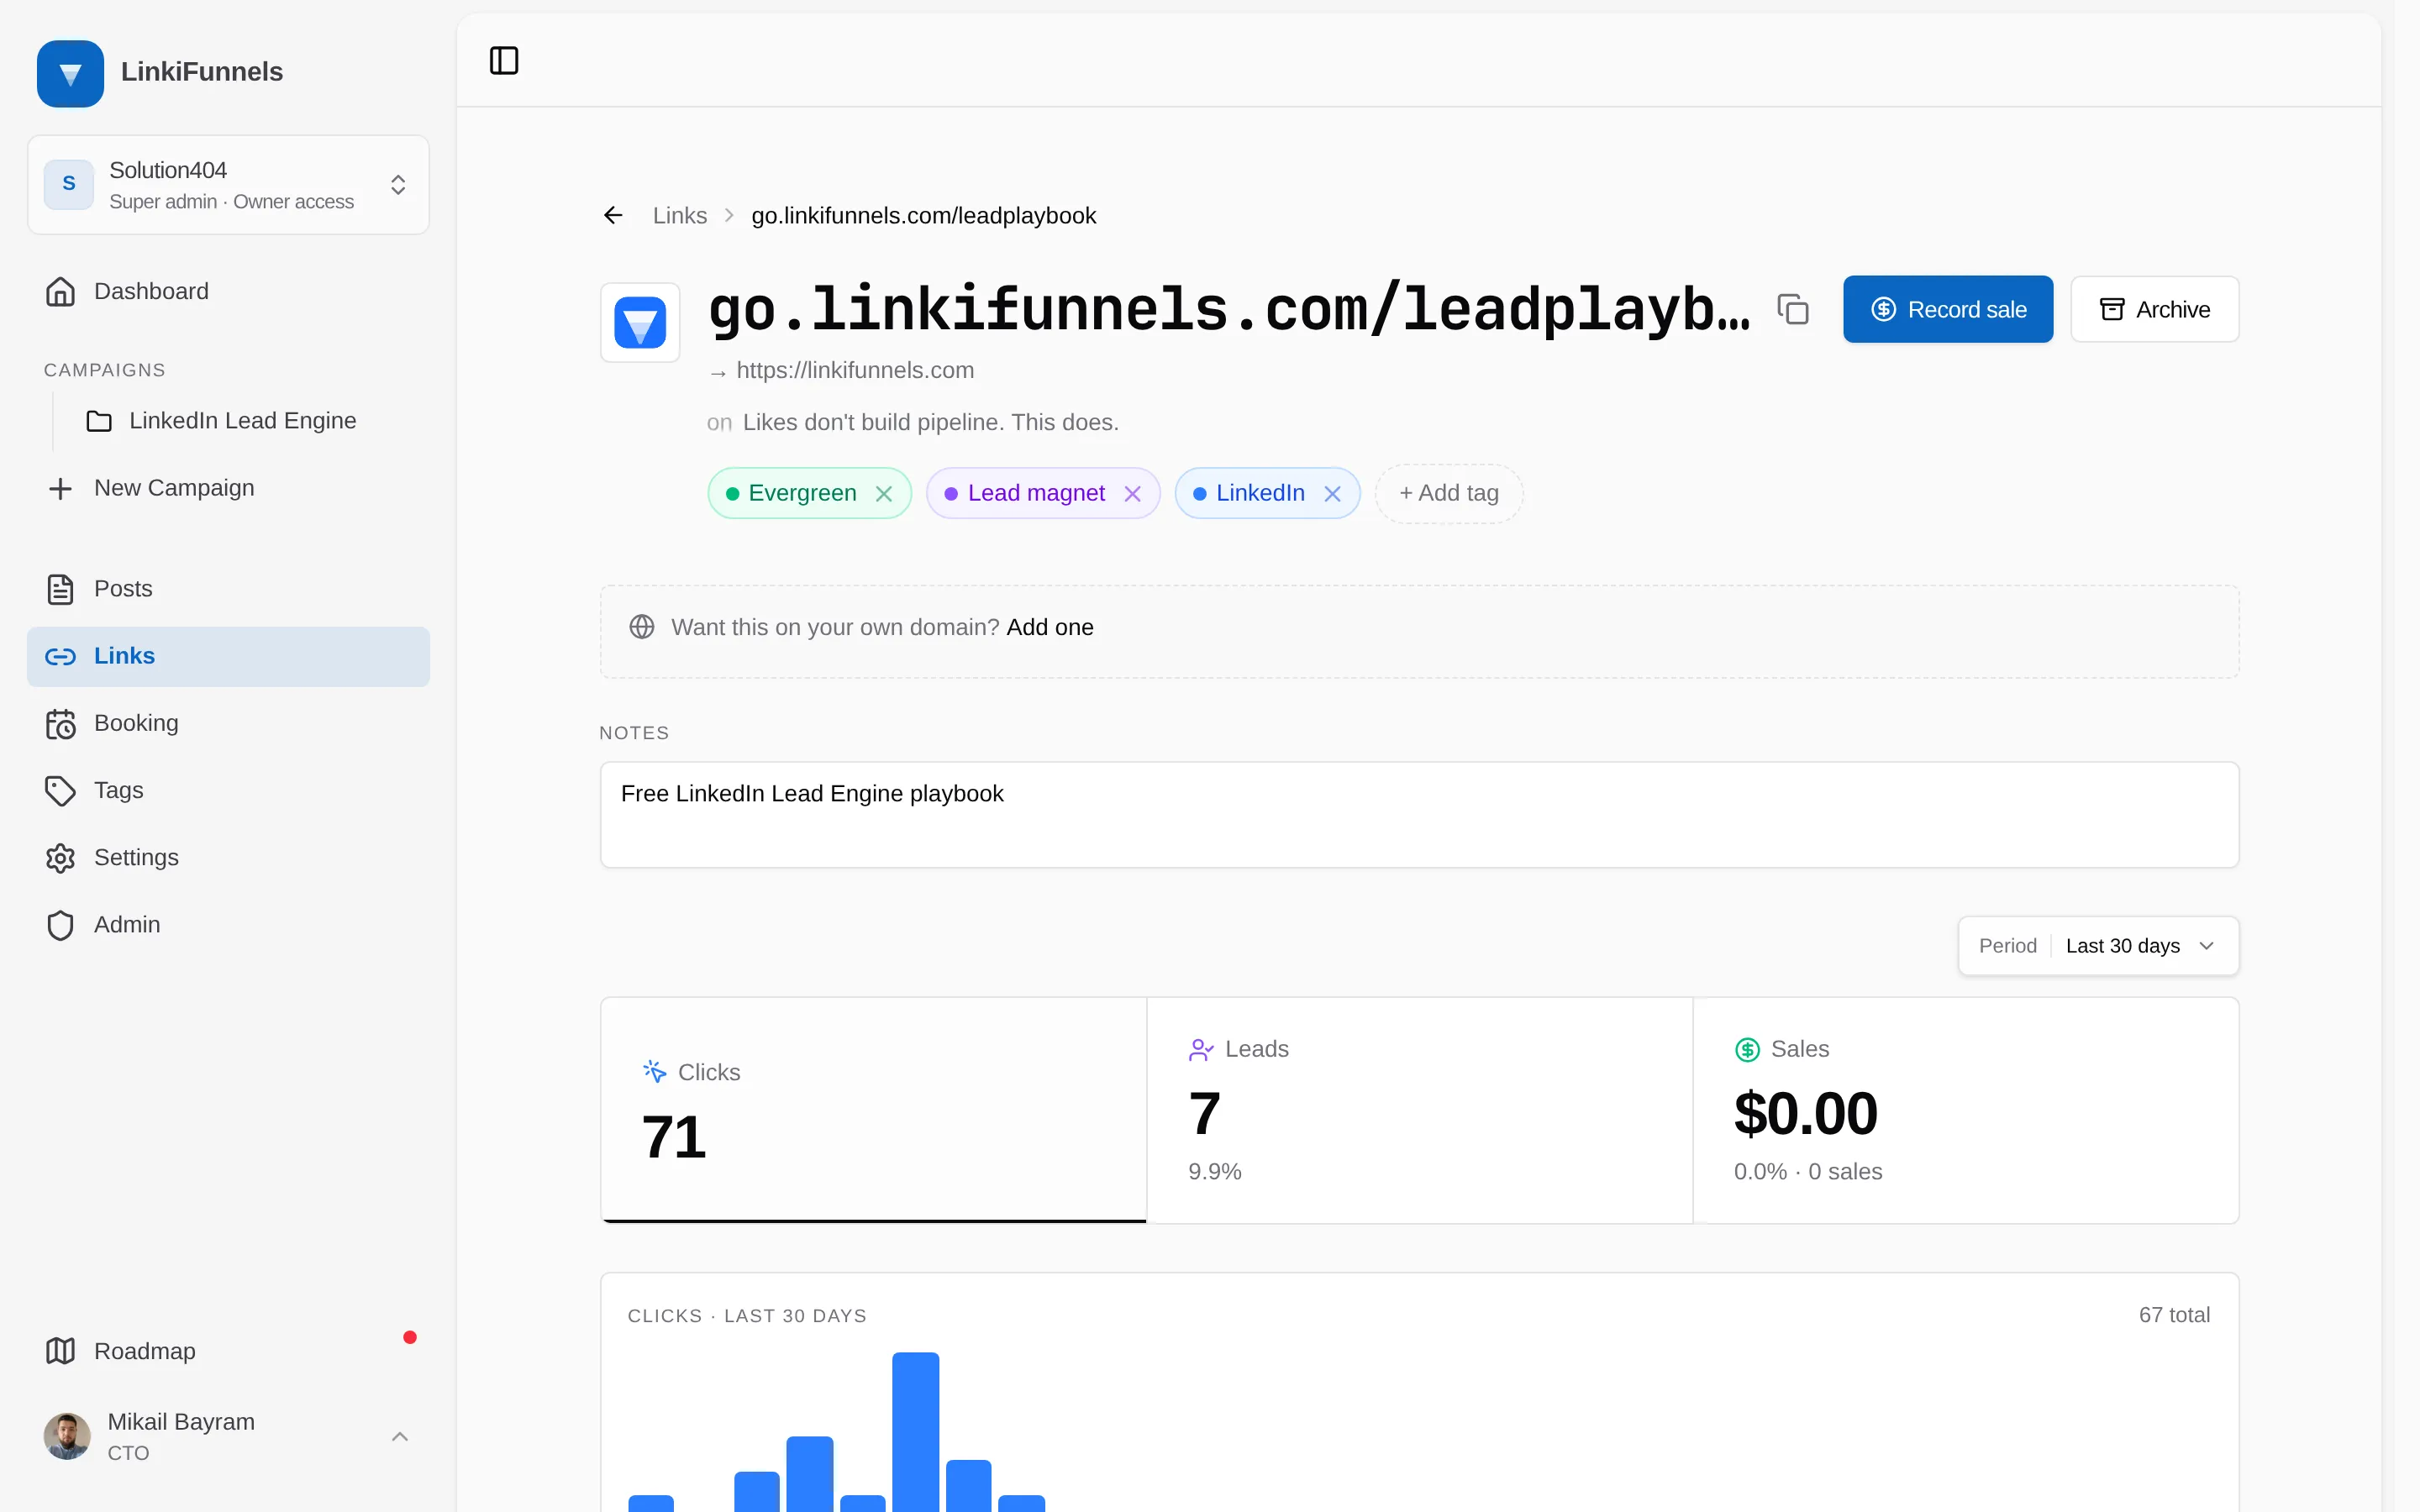
The three numbers
Section titled “The three numbers”| Card | Counts |
|---|---|
| Clicks | Human visits to the short link. Automated traffic is stored but not counted, see How clicks are counted |
| Leads | People who left an email through your site’s form or the API after clicking this link |
| Sales | Sales recorded against this link, with revenue and conversion rate |
Click a card to switch the daily chart and the recent activity feed to that metric.
Sales can also be recorded by hand directly on a post or campaign without a link. Those count toward the post and campaign, so a campaign’s revenue can be higher than the sum of its links.
Date range
Section titled “Date range”Choose 7 days, 30 days, or all time. The default is 30 days. The KPI cards, chart, and breakdowns all follow the range.
Behavior and location
Section titled “Behavior and location”For clicks, two cards break the total down:
- Behavior: devices, browsers, operating systems, and sources. Source is where the click came from: LinkedIn, Twitter, email, direct, or other.
- Location: countries.
Leads and sales are attributed to the device and country of the click that produced them, so the same breakdowns work for those too.
Recent activity
Section titled “Recent activity”The feed lists individual clicks with time, source, device, browser, operating system, and country, ten at a time. For leads it shows the date, event, customer, email, and country. For sales it adds the amount, and a Record sale button above the list lets you add one.